
How to Compare Linear and Quadratic Functions in Graphs
Quick Answer
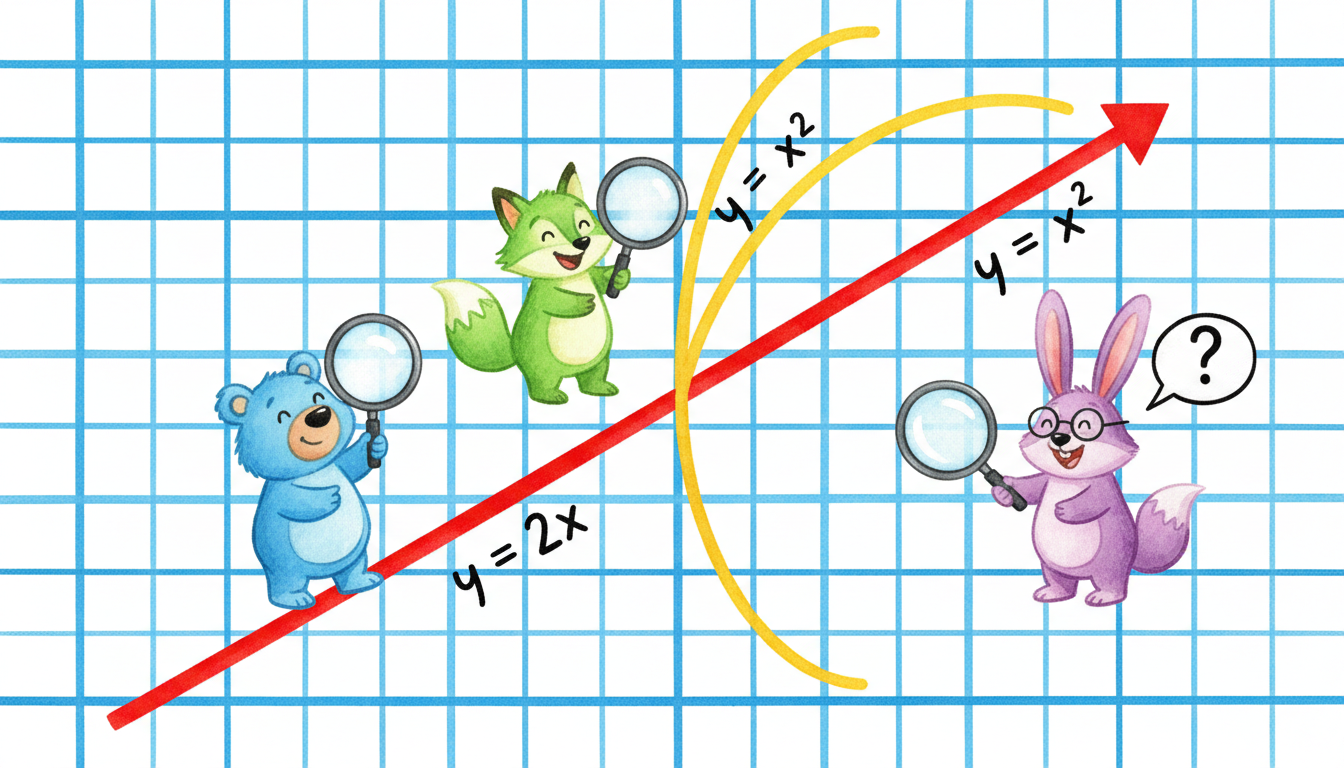
To compare linear and quadratic functions, identify their characteristics such as slope and y-intercept. For instance, a linear function like y = 2x has a constant rate of change, while a quadratic function has varying rates of change and a distinct shape on a graph.
When comparing linear and quadratic functions, it's essential to understand the distinct characteristics that define each type of function. A linear function, such as y = 2x, represents a straight line on a graph. This function has a constant rate of change, meaning the slope is always the same. In this case, the slope is 2, which indicates that for every 1 unit increase in x, y increases by 2 units. The y-intercept of this line occurs when x is 0, resulting in y = 0. Thus, the y-intercept is at the point (0, 0).
On the other hand, a quadratic function, often represented in the form of y = ax² + bx + c, describes a U-shaped curve or parabola, depending on the values of the coefficients. For example, if we have a quadratic function that intersects the y-axis at (0, -2), this means that when x = 0, y = -2. The shape of the parabola means that the rate of change is not constant; it varies depending on the value of x. As x moves away from the vertex of the parabola, the slope increases or decreases, indicating that the rate of change is not fixed.
When comparing these two types of functions, you can make several observations:
1. **Y-Intercept Comparison:** In our example, Function 1 (y = 2x) has a y-intercept of 0, while Function 2 (the quadratic function) has a y-intercept of -2. Therefore, Function 1 has the larger y-intercept, which signifies that it starts higher on the y-axis compared to Function 2.
2. **Rate of Change:** The linear function y = 2x has a constant rate of change due to its slope of 2. Conversely, the quadratic function has a varying rate of change, as the slope will change at different points along the curve. This means that as you move along the quadratic function, the steepness of the curve will increase or decrease, unlike the straight line of the linear function, which remains the same.
3. **Graphical Representation:** On a graph, the linear function will appear as a straight line, while the quadratic function will curve. This visual representation can help in analyzing and understanding the differences between the two types of functions.
In real-world applications, linear functions are often used to represent constant rates, such as speed or cost, while quadratic functions can model scenarios like projectile motion or areas of squares. Understanding how to compare these functions is crucial in algebra and helps build a foundation for more advanced mathematical concepts.
In summary, when comparing linear and quadratic functions, focus on their slopes, y-intercepts, and how their graphs differ. These concepts are fundamental in algebra and will aid in grasping more complex mathematical ideas in the future.
Was this answer helpful?