
Understanding Independent and Dependent Variables in Graphing
Quick Answer
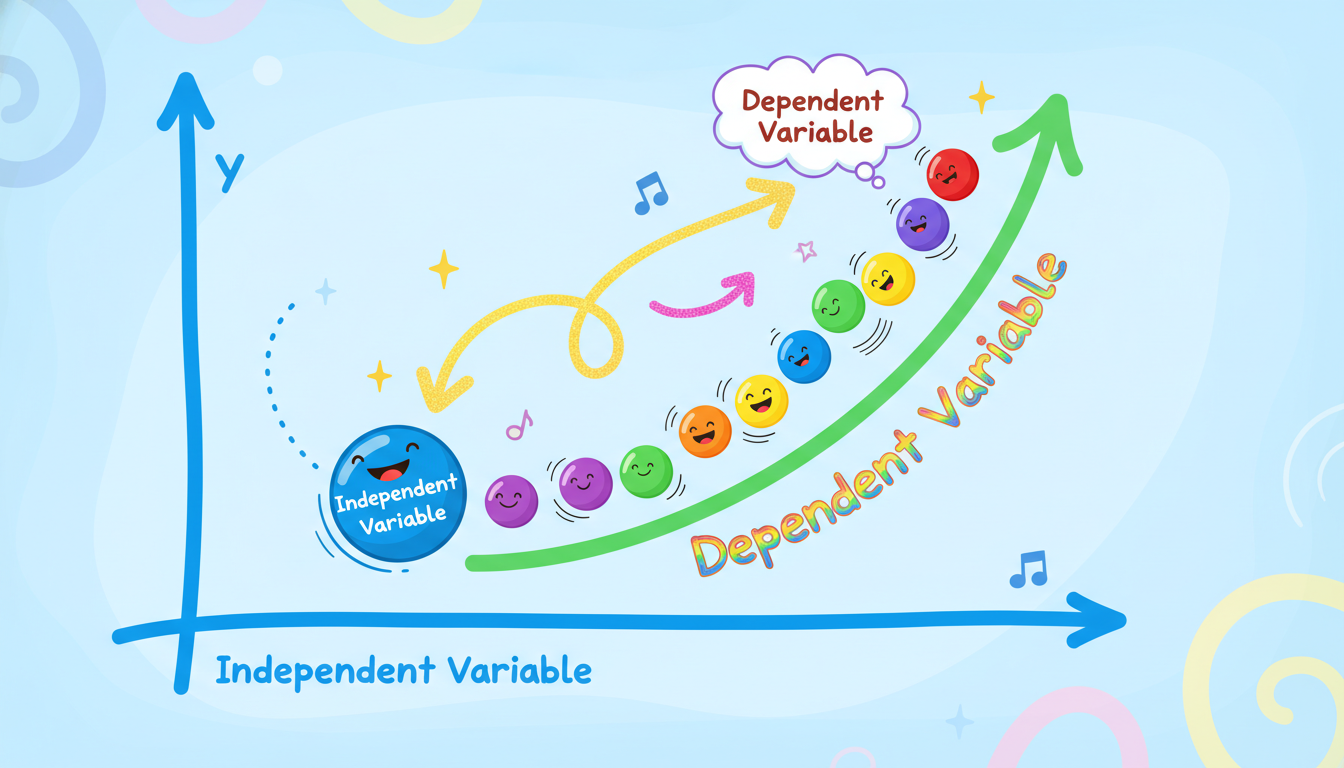
In graphing, the independent variable is plotted on the x-axis, while the dependent variable is on the y-axis. The dependent variable's value changes based on the independent variable's value.
When graphing, understanding the roles of independent and dependent variables is crucial. The independent variable is what you manipulate or change in an experiment or equation, and it is typically represented on the x-axis of a graph. The dependent variable, on the other hand, is what you measure or observe; it relies on the independent variable and is plotted on the y-axis.
For example, consider a simple experiment where you want to study how the amount of sunlight affects the growth of a plant. Here, the amount of sunlight your plant receives would be the independent variable, as you can control how much sunlight it gets. The growth of the plant, measured in centimeters, would be the dependent variable because it depends on the sunlight exposure. When you plot this data, you would place the sunlight hours on the x-axis and the plant growth on the y-axis.
This relationship can be visualized in a graph where each point corresponds to a pair of values (x, y). As you increase the sunlight hours (independent variable), you may observe an increase in plant growth (dependent variable).
Understanding this concept is not only vital for academic purposes but also applies to real-world scenarios. For instance, in economics, the price of a product may be the independent variable, while the quantity sold is the dependent variable. By analyzing graphs with these variables, you can make predictions and understand trends in various fields.
In summary, the key takeaway is that the independent variable is what you change, and the dependent variable is what you observe as a result of that change. This foundational concept will enhance your understanding of graphing and data interpretation.
Was this answer helpful?